Product
Choosing the Best Route Optimization Engine | Part 2
 Yuzhe Yan
Small and large businesses alike rely on route optimization software to help save them time and money across the entire delivery process. But with all of the mainstream platforms on the market, choosing the right product for your business can be difficult. Keep reading to learn more about the benefits of choosing the best route optimization engine— LogisticsOS.
How to Know Your Vehicle Routing Solution is Good?
There are many elements that contribute to the quality of route optimization software; traditionally, we consider total travel time, total route distance, and total cost as the main contributing factors. Mathematically, these metrics are used to measure solution quality because is all about minimizing your objectives. In reality, however, customers also look at the cluster quality. In other words, the less your routes cross over with each other, the better.
The Data
Let’s take a look at the instance Antwerp1 from Arnold, Gendreau, and Sörensen dataset. With 6000 stops, LogisticsOS VRP solver took 266s to return a solution with a sum of the distance of 486917, which is 2% higher than the best-known solution of 477277.
At first glance, our solution has a 2% gap over best known. Yes, we could do better than that. But let’s take a closer look and compare the two. By number, the solution returned by our solver takes 2% more distance than the best known provided on the benchmark website. However, in reality, a logistics operations manager is highly likely going to reject the best-known solution. Why? Let’s plot both solutions on a 2D flat grid and take a closer look (lines from depot and to depot are omitted).
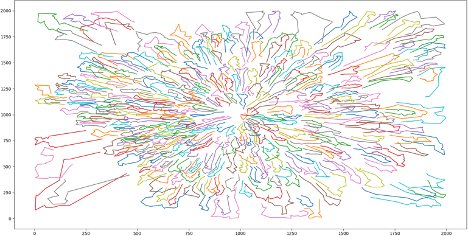 Best known solution for Antwerp1
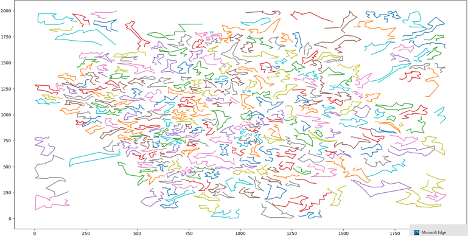 LogisticsOS solution for Antwerp1
The difference is the cluster quality. The best known solution has way too many overlaps between routes. This raises many complains from the drivers and results in worse ETA. Human drivers prefer to stay within one local region and tend to think the route plan is not optimized when he sees his co-worker driving on the same street, even though it is better in numbers.
So yes, we could absolutely do better than the 2% gap. But by just changing the construction heuristic to Clarke and Wright Savings algorithm, we could close the gap to 0.5%, but there would be many layovers between routes; the last thing we or our customers want is excessive overlap.
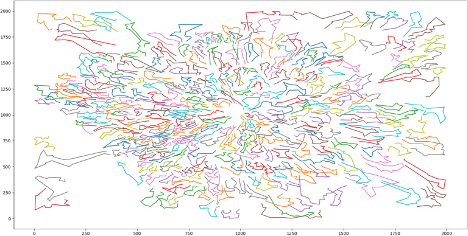 LogisticsOS solution for Antwerp1
Many solvers tend to do cluster first then solve second to achieve a better-clustered solution. They either use a fuzzy split method or apply clustering algorithms (p-median, k-means, DB scan) based on demand and customer’s geoinformation and then solve each smaller set of the original problem. However, this often leads to a suboptimal solution. It will fail when customers are sparsely located, demands are not evenly distributed, or there are non-overlapping time windows or vehicle type matches constraints or other types of complicated constraints, TLDR. The less the problem is split, the better the solution quality. Are we saying LogisticsOS VRP solver does not split nor pre-cluster the input locations? No, we never split, ever. The secrets lie in constructing the initial solution in a clean and scalable manner. We use the Lin-Kernighan algorithm to traverse and connect neighborhood graphs. The process is complicated but powerful. With our unique construction algorithm, we can add all complicated real-world constraints without sacrificing speed.
About LogisticsOS
LogisticsOS is the most powerful route optimization system on the market. Our flexible, hosted route optimization and planning/replanning APIs require no knowledge of optimization techniques. High-quality results are returned within seconds— even at scale. From time reduction and vehicle capacity to depot automation and cost customization, our feature-rich software can create the efficiency and cost-savings that you need. Contact us today for a free product demo.

